Analytics: Growth Rates
Part I of Analytics attempts to answer the first question: is past economic growth a good indicator of future economics growth?
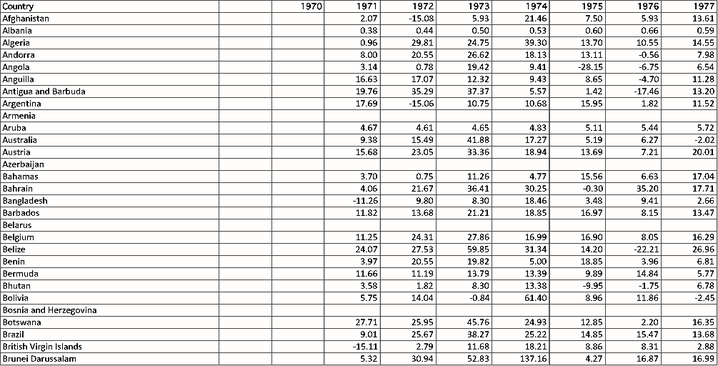
To address this question, I opened a new Excel-sheet called “GDP Growth Rates(%)” to compute the annual percentage change in per-capita GDP from the original data-set. The growth rate of a country's per-capita GDP acts as a proxy for that country's annual economics growth rate. As an illustration, I calculated the percentage change in per-capita GDP of Afghanistan in 1971 by:
(Per-capita GDP in Afghanistan in1971-Per capital GDP in Afghanistan in 1970) *100%/ Per capital GDP in 1989
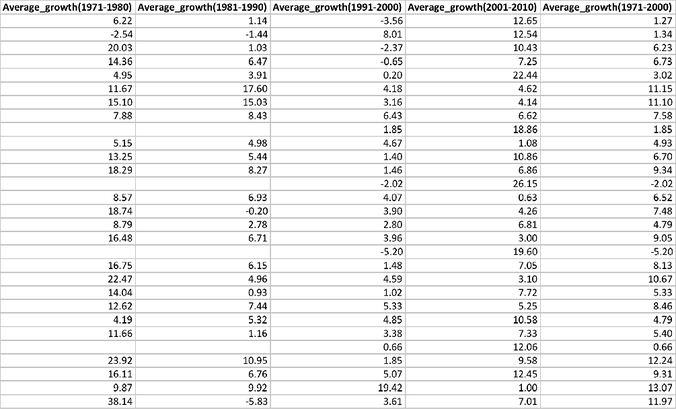
The next step is to compute the average per-capita GDP growth rates from 1971 to 1980, from 1981 to 1990, from 1991 to 2000, and from 2001 to 2010 for each country. The average per-capita GDP growth rate from 1971 to 1980, for example, can be calculated by:
(Growth rate in 1971+growth rate in 1972+......+growth rate in 1980)/10
The AVERAGE function in Excel helped me to perform this task.
To address this question, I opened a new Excel-sheet called “GDP Growth Rates(%)” to compute the annual percentage change in per-capita GDP from the original data-set. The growth rate of a country's per-capita GDP acts as a proxy for that country's annual economics growth rate. As an illustration, I calculated the percentage change in per-capita GDP of Afghanistan in 1971 by:
(Per-capita GDP in Afghanistan in1971-Per capital GDP in Afghanistan in 1970) *100%/ Per capital GDP in 1989
The next step is to compute the average per-capita GDP growth rates from 1971 to 1980, from 1981 to 1990, from 1991 to 2000, and from 2001 to 2010 for each country. The average per-capita GDP growth rate from 1971 to 1980, for example, can be calculated by:
(Growth rate in 1971+growth rate in 1972+......+growth rate in 1980)/10
The AVERAGE function in Excel helped me to perform this task.
The last step is to compute the correlation coefficient between:
A) Average growth rate from 1971 to 1980 and average growth rate from 1981 to 1990
B) Average growth rate from 1981 to 1990 and average growth rate from 1991 to 2000
C) Average growth rate from 1991 to 2000 and average growth rate from 2001 to 2010
The CORREL function in Excel helped to calculate the three coefficients. One way to understand correlation coefficient is that it is a measurement of the relationship between two sets of data, and the value of the coefficient ranges from -1 to 1. A correlation coefficient of 1 means that the two datasets have a positive linear relationship; in this case, if the average growth rate from 1971 to 1980 and average growth rate from 1981 to 1990 have a correlation coefficient of 1, this would imply that past economic growth is a perfect indicator of present/future economic growth.
The correlation between growth in one decade and growth in the next decade is not as strong as I anticipated. As a matter of fact, I found negative correlation in two out of the three cases. The correlation coefficient for A) is -0.1100, for B) is 0.1787, C)-0.2209. The negative correlation in C), for example, implied that a country with an above-average growth rate from 1991 to 2000 has a slight tendency to under-perform from 2001 to 2010.
To address my initial question, past economic growth is not a very good indicator of present or future economic growth.
