Analytics: U.S._Compare
Part II of Analytics attempts to answer my second question regarding economic growth: how fast different countries’ grow compared to one another? Which countries are the out-performers?
To examine this question, I took two steps:
A) Compare each country’s pattern to that of the United States.
B) Construct an interactive table to compare all countries’ economic growth rate to one another.
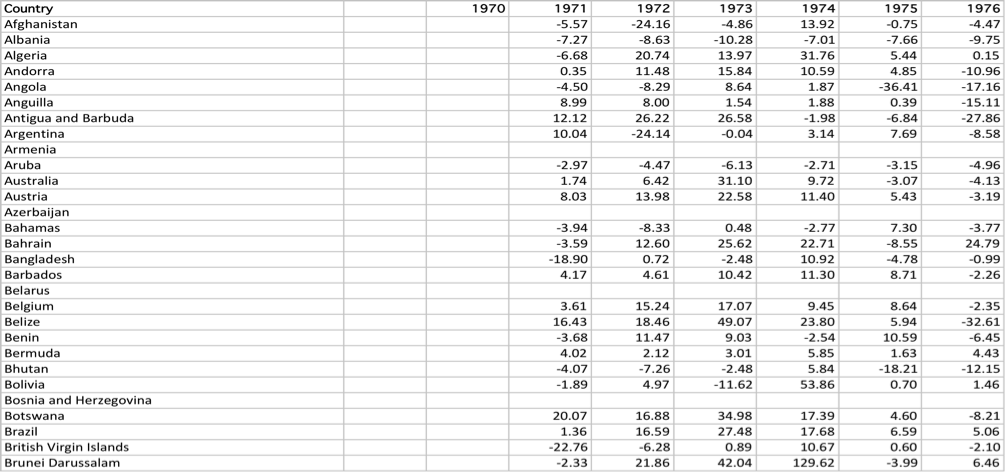
To accomplish step A), I opened a new Excel-sheet called “United States_Compare” to compute thedifferences in annual per-capita GDP growth rates between each country and the United States; all countries’ annual growth rate can be obtained from the previous spreadsheet “GDP Growth Rates(%)”. For example, I calculated the difference in economic growth rate between Afghanistan and the U.S. in 1971 simply by:
(Per-capita GDP growth rate in Afghanistan in 1971- per-capita GDP growth rate in U.S. in 1971)
The Excel formula is =If(iserror('GDP Growth Rates(%)'!D2-'GDP Growth Rates(%)'!D$207),"",'GDP Growth Rates(%)'!D2-'GDP Growth Rates(%)'!D$207)
I applied the same formula to all countries in all years; the figure on the right captures part of the United States_Compare spreadsheet. It shows the differences in per-capita GDP growth rates between the first 29 countries and the United States from 1971 to 1976.
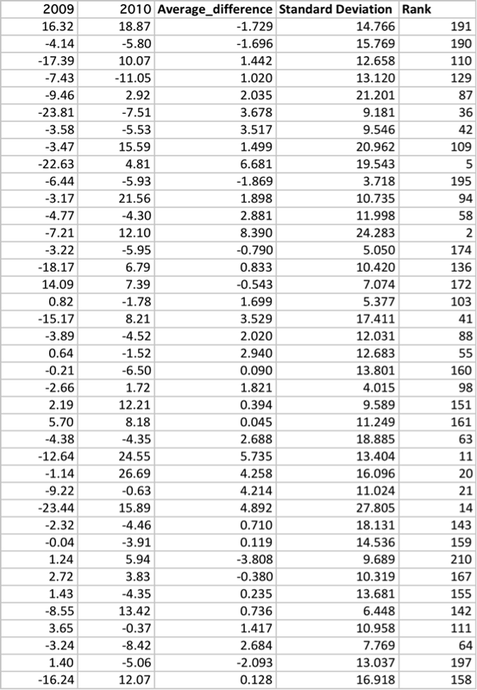
Then I added a new column AR at the end of the “United States_Compare” spreadsheet to average the difference in annual economic growth across all years. In other words, the average of differences in growth rates between country X and the United States can be calculated by:
(Difference in growth rate in 1971+difference in growth rates in 1972+…..+difference in growth rates in 2010)/number of years
Again the AVERAGE function helped me to perform this step.
Finally, I ranked all the data I obtained in column AR. The data is ranked in a descending order, so the country that ranks number 1 is the country grew the fastest when compared to the U.S.
The Excel-formula to assign a ranking to Afghanistan, for example, is =Rank(AR2,$AR$2:$AR$217)
To examine this question, I took two steps:
A) Compare each country’s pattern to that of the United States.
B) Construct an interactive table to compare all countries’ economic growth rate to one another.
To accomplish step A), I opened a new Excel-sheet called “United States_Compare” to compute thedifferences in annual per-capita GDP growth rates between each country and the United States; all countries’ annual growth rate can be obtained from the previous spreadsheet “GDP Growth Rates(%)”. For example, I calculated the difference in economic growth rate between Afghanistan and the U.S. in 1971 simply by:
(Per-capita GDP growth rate in Afghanistan in 1971- per-capita GDP growth rate in U.S. in 1971)
The Excel formula is =If(iserror('GDP Growth Rates(%)'!D2-'GDP Growth Rates(%)'!D$207),"",'GDP Growth Rates(%)'!D2-'GDP Growth Rates(%)'!D$207)
I applied the same formula to all countries in all years; the figure on the right captures part of the United States_Compare spreadsheet. It shows the differences in per-capita GDP growth rates between the first 29 countries and the United States from 1971 to 1976.
Then I added a new column AR at the end of the “United States_Compare” spreadsheet to average the difference in annual economic growth across all years. In other words, the average of differences in growth rates between country X and the United States can be calculated by:
(Difference in growth rate in 1971+difference in growth rates in 1972+…..+difference in growth rates in 2010)/number of years
Again the AVERAGE function helped me to perform this step.
Finally, I ranked all the data I obtained in column AR. The data is ranked in a descending order, so the country that ranks number 1 is the country grew the fastest when compared to the U.S.
The Excel-formula to assign a ranking to Afghanistan, for example, is =Rank(AR2,$AR$2:$AR$217)